The following charts tell a story of increasing economic crisis for workers.
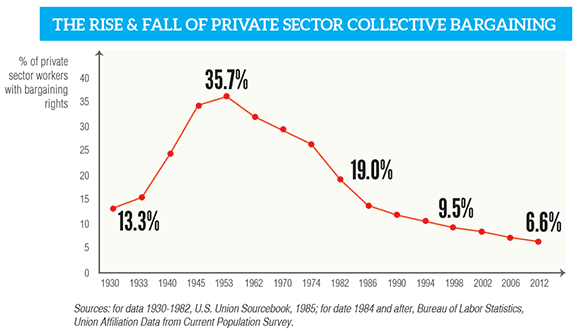
This chart is critical for two reasons:
From 1930 to 1960, we see how working Americans built a movement, including the CIO that founded CWA. More than 10 million Americans won private sector bargaining rights!
But the last 50 years of offshoring, plant closings and union busting have pushed collective bargaining levels back to the era before the Great Depression. This affects all of our bargaining, including the public sector, which rose during the last 50 years but now also is under attack.
As collective bargaining coverage declines, so do real wages for 99% of workers.
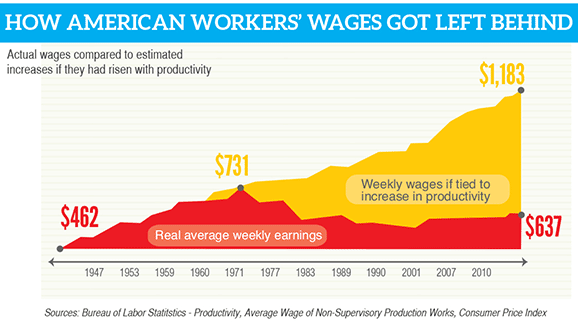
U.S. workers now work more for less. When we look at real wages of American workers over the past 70 years, we see that the attacks on private
sector collective bargaining affect all Americans.
Real wages means pay adjusted for inflation. Productivity means the total value of what we produce, divided by the number of workers.
This chart shows that when collective bargaining was increasing, and for some years after that, real wages kept up with productivity. But as collective bargaining in the private sector declined over the last 40 years, real wages did not keep up with productivity. The gap, shown in gold, is currently more than $500 per week. This stagnation in pay has dire consequences and means that we cannot buy what we produce. Economists call this the collapse of the demand side of the economy. One cause of the housing crisis was the combination of stagnant wages and rising housing prices that led to flim flam mortgages.

Workers in many other countries enjoy greater collective bargaining rights than their U.S. counterparts, especially working women and men in other democracies. The global economy doesn’t have to mean no voice on the job, no organizing or bargaining rights and stagnant real wages. In this chart we see that even when we include the U.S. public sector, the U.S. at 12% collective bargaining coverage ranks last among the democracies shown. Nations like South Africa and Brazil have seen huge increases in the percentage of workers with bargaining coverage. Others on the chart have maintained much higher bargaining coverage despite pressures from a global economy.
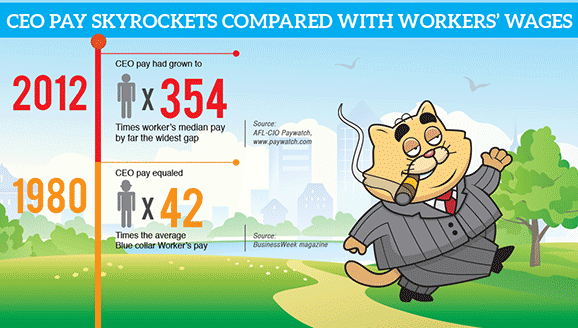
Coalitions often form out of a collective desire to fight corporate greed and the seemingly insatiable 1%. The income disparity in the U.S. is the largest in decades and the worst of any global democracy.